The animation shows a full period of the pulsar PSR B0531+21 with its two maxima resolved in time. Due to the low brightness and the recording technique the image quality is unfortunately not very high. This animation was taken on 17.01.2021 by Martin Fiedler at the observatory Radebeul (Germany) with a 24" f/3.3 GoTo Dobson and a QHY174M-GPS camera in combination with an OVNI-M night vision device. Summarized, here the single frames of a 15 second video sequence with 5ms exposure time each were successfully merged according to the pulsar frequency. If needed I can also provide an animation without the time insertion.
Here is some additional information about the creation of the video:
According to my research on the pulsar, it has two maxima in the 33.5ms of its period, one bright and one fainter, both lasting about 5ms. This results in the minimum necessary exposure time (5ms). In addition, the pulsar is very close to another star and must be spatially resolved accordingly. So I extended the focal length, which also helps to recognize the pulsar, because the high background brightness due to the nebula is reduced.
On a 5ms frame you can't recognize stars with 15 or 16 mag even with a cooled CMOS camera + night vision device, for that the noise too high. The only option, as is often the case, is to stack enough images to get the faint pulsar out of the noise. That's when I had the idea to use our QHY-174M-GPS camera, which is actually there to measure star occultations by asteroids and can set an accurate GPS time stamp. With this, one could assign to each frame its exact location in the period of the pulsar, and then stack them precisely. For this purpose I equipped the telescope with a Barlow lens, the OVNI-M night vision device without lens/eyepiece and the QHY174M-GPS camera with a 50mm f/1.4 lens. The NVD was running at maximum gain and also the camera was at the limit with the gain but cooled down to -40°C.
Then I had to get the timestamp from the single images, rounded appropriately, into the file name. For this I searched for a long time for a useful OCR software. It would be easier if the SharpCap would do it right away (somehow I couldn't manage that). Then I built an table and took the timestamp of the first image as the beginning of the period. Then you need the exact period of the pulsar (0,033781965), which changes every year, I didn't know that before. Now I always add the full frequency to the first timestamp for the complete recording period. This resulted in the end in a column with nearly 500 values (times) in my case. Then you have to do the same for the remaining 33ms of the period (each new column +1ms). Then I built a program to find the frames matching the period times and copy them into the corresponding folders. In the end I had 34 folders with about 80 frames in each. I stacked them all manually in Fitswork, the flashing of the NVD makes an automatic detection of even the brightest star impossible. Since the star was also not clearly visible everywhere, I could usually only really use 50-60 images.
The chance that this really works out I had rather classified as low, it was completely unclear whether the time stamp of the camera is accurate enough and whether the OVNI-M can even resolve 5ms in time. But it really worked and in the animation you can see the main and the secondary maxima cleanly separated. The image quality is grotty but it worked. With a bigger telescope, better seeing and less noise I'm sure it would work without stacking, but I don't have it. Nevertheless I am very satisfied and happy with the results.
In this video we see the apparent motion of Jupiter and Saturn, the two gas giants of our solar system, from 01-05-20 to 21-12-20, the day of the Great Conjuntion.
47 photos, taken at approximately 5 days intervals, reveal the cosmic dance of the two planets in our sky. The background photo is from Cape Tainaron, Greece, taken at 19-08-20.
Equipment: Canon EOS 4000D & EF-S 18-55mm at 18mm
for the close-up of the Great Conjunction I also used Sky-Watcher Skymax 90 & Star Adventurer, Celestron Plossl 1.25" 8mm eyepiece
Edit and video rendering with Photoshop CC
Mars & Uranus, 2020-'21
2020 was a good year for Mars observing, with the red planet coming to a perihelic opposition on 13-14th October and shining as bright as mag. -2.6. Uranus was also visible in Aries, performing a much slower retrograde motion of its own. Here, motions of Mars and Uranus can be followed from early July 2020 until the the first week of February 2021.
Another object of interest is Mira, the pulsating variable red giant star in Cetus, visible near the bottom left corner. During the course of 7 months, Mira can be seen to initially shine at mag. 8, then slowly going brighter. Just as Mars' opposition approaches, Mira reaches its yearly maximum in the first week of October, at mag. 3.2. After that, Mira can be seen getting dimmer, as faint as mag. 7 at the end.
Copyright: Tunç Tezel
A reconstructed view of the Jezero crater from around 11km above the surface. The final image was made from LCAM, RDCAM and PUCAM images. It took me over 120 hours to process the images, align, stitch, stack, adjust brightness, sharpen and create the final video. It is a 360°version, so do not forget to drag it and look around. You can also use the + key to zoom in on your desktop/notebook. You can also use your phone as a kind of window to look around. Or you VR headset of choice.
I also used the information about the cameras from:
Maki, J.N., Gruel, D., McKinney, C. et al. The Mars 2020 Engineering Cameras and Microphone on the Perseverance Rover: A Next-Generation Imaging System for Mars Exploration. Space Sci Rev 216, 137 (2020) https://link.springer.com/article/10.10 ... 20-00765-9
Equipment: Canon EOS 4000D, EF 75-300mm at 135mm and 300mm & EF-S 18-55mm at 18mm
& Sky-Watcher Star Adventurer
Edit and video rendering with Photoshop CC
Hi!
So, we all have already seen the apparent stars motion because of the earth's rotation, but have you seen how we are moving according to the stars?. Here is a timelapse using a star tracker in the Villarrica volcano, the most active volcano in my country (Chile), with follow-up to the southern cross, agena and rigil kentaurus. and the coalsack nebula.
Exif: Nikon d850, Lens Nikkor 50mm f1.4, iOptron Skytracker Pro and Tripod Benro GA168TB1
Timelapse: 264 frames at 24 fps.
each photo: 50mm f3.5 ISO 2500 30" ( *The landscape is not blurry due to motion at 24 fps)
Place: Villarrica volcano, The Araucania region, Chile.
Date: December 17th, 2020
Time: 01:50 AM
Copyright: Vineeth Kaimal (TheUrbanAstronomer.com)
Date: 24-April-2021
Location: Bengaluru, India
Zero shadow days are days when the Sun will be directly overhead and because of this objects like blocks and cylinders will not cast a shadow when the Sun is at its highest point. It also means that if we keep a Newtonian telescope level on the ground (WITH A SOLAR FILTER and all usual solar observation precautions), the Sun will come into view at zenith. No mount required! Zero shadow days occur twice a year in all locations between the Tropic of Cancer and the Tropic of Capricorn. The date it occurs will depend on the latitude of the location.
The Super Flower Blood Moon Lunar Eclipse is coming May 26!
This footage:
Total Lunar Eclipse & occultation of o Cap A / B
Observed with a NexStar 4SE between Grünau and Keetmanshoop, Namibia.
The interval of this time lapse was 4 sec. But we recorded this occultation on a 150 meter line from 4 video stations.
GPS of this location:
S 27°16'43.45"
E 18°58'48.88"
ALT. 1395 m
Copyright: Vineeth Kaimal (TheUrbanAstronomer.com)
Location: Bengaluru, India
Date: 21-June-2020
Equipment: iOptron CEM25P, GSO 6 Inch F5 Newt, Baader Solar Filter, Nikon 1 J5
Processing: Hitfilm Express
The footage is from the solar eclipse of June 2020 zooming in on the edge of the Moon against the Sun. Due to lunar features like mountains and craters at the edge of the moon as seen from Earth, we can see that the edge of the Moon's silhouette set against the bright Sun during a solar eclipse is rough and not a smooth curve.
Sunset in Hydrogen Alpha Wavelength
Copyright: Michael Teoh
Click to play embedded YouTube video.
This is my second successful attempt at taking a sunset sequence in the hydrogen alpha wavelength. This time the western sky was perfectly clear. The huge sunspot in AR2835 and a number of bright prominences along the upper limb are clearly visible.
mejrh known as M51 and NGC 5149, or as it is called Whirlpool Galaxy ..
This image was taken by the Hubble Space Telescope HST
You have processed the data with the appropriate programs.
Picture Color Format: HαRGB
The clouds of ionized hydrogen gas are shown through the bright red color that expresses the Hα spectrum, the spectrum released by ionized hydrogen, with a wavelength of 658nm in this image.
I used the f658n filter installed in the Hubble Space Telescope For the RGB colors, they are the same colors we look at, and the following filters were used in their installation:
B: F435W
G:F555W
R:F814W
The camera whose frames (photos) were used are:
ASC WFC
ECLIPSE BETWEEN JUPITER'S MOONS: IO GIVES GANIMEDES A BITE
On the night of August 18, as three of Jupiter's moons approached the gas giant, the moon Io gave a "bite" to Ganymede; an eclipse between moons was taking place and we had the privilege of seeing it and photographing the sequence.
This curious celestial spectacle lasted a few minutes, just before the shadow of Jupiter began to hide both moons.
As Ganymede and Io moved from left to right and passed behind Jupiter, the moon Europa, at the other end, began to travel from right to left in front of the largest planet in the Solar System.
Notice the detail in the moons, despite the distance (600 million km today) and the small size, Ganymede and the moon Io, show details and albedo variation.
As far as we have investigated, there are a few images of eclipses between the moons and most with little detail. More scarce are detailed videos of such events.
Equipment:
Meade 10" LX200-ACF (telescope)
Tele Vue 4x Powermate (basically, a Barlow lens)
ZWO Atmospheric Dispersion Corrector (ADC)
ZWO filter wheel
Astronomik RGB filter set
ZWO ASI290MM (camera)
Software:
FireCapture
AutoStakkert!
RegiStax
WinJUPOS
GNU Image Manipulation Program (GIMP)
Topaz Sharpen AI
GarageBand (for the music)
CyberLink PowerDirector (to combine images into video format)
Acquisition and processing details:
Atmospheric seeing conditions were quite good that night, not necessarily excellent, but at least pretty darned good.
Exposure time was adjusted in FireCapture to keep the frame rate as reasonably high as possible, and the camera gain was adjusted to keep the right-most side of the histogram curve between 1/2 to 1/3 below saturation. 781 GB of raw data taken between 07:28 and 09:53, 2021-08-16 UT, in the form of 1 minute long SER video files, alternating between physical Red, Green, and Blue filters (438 files total, 146 for each color filter). About every ~18 minutes, I re-leveled the ADC and checked focus.
AutoStakkert! was used to process each SER file, producing a TIFF image file for each. 50% of frames were stacked, no normalization.
RegiStax wavelet sharpening was used on each TIFF file, to produce sharpened images.
WinJUPOS "De-rotation of images..." tool was used to produce frames for each 30 second real-time interval (from 07:28 to 09:53 timestamps) based on the nearest 3 (sometimes 4) images from the previous step, for a smooth progression, maintaining continuity. This was done separately for each of the physical Red, Green, and Blue filter sets of images.
WinJUPOS "De-rotation of R/G/B frames..." tool was used to combine the images in the previous step into color images. No actual "de-rotation" was done in this step, since that was done in the previous step, however, the tool was used to align the three sets of monochrome images into a single set of RGB color images.
Used python scripts (plugins) in GIMP to adjust contrast and saturation of all images from the last step.
Topaz Sharpen AI was used for a final sharpening/denoise step. At this point, there were 291 color images, each corresponding to a real-time 30 second interval, ready for the video (9.7 seconds of video at 30 fps).
Threw together some music in GarageBand.
CyberLink PowerDirector (plus some text and stuff produced in GIMP) was used to make the video out of all of that.
During the month of August, +700 meteors were registered at the monitoring station in Monte Castelo-SC, Brazil.
Click to play embedded YouTube video.
Some bolides (explosive meteors) were registered, one of them fell on the municipality of Monte Castelo and turned night to day for a few moments. Meteor falls with persistent trails, long duration meteors and others of lesser magnitude were also seen.
Most meteors are sporadic (which are not from any known meteor shower yet). Preliminary analyzes also suggest that many of the meteors belong to the radiant rains named: August omicron Aquariids, August iota Cetids, epsilon Aquariids, eta Eridanids, Southern iota Aquariids, Piscis Austrinids, lambda Aquariids, Southern delta Aquariids, nu Phoenicids, Northern delta Aquariids , Aurigids and others.
Moon Phases and Libration from 2021 August 15th to September 13th
Moon phase photography: The photos of the moon were taken from August 15th, age of moon of 7.2, through September 10th, age of moon of 3.6. On September 11th, typhoon #14 Chanthu began to hit Taiwan and interrupted the progress. A friend Bob in Phoenix, Arizona agreed to complete the last three moon phase photographs that ended on September 13th, age of moon of 6.7. Through the cooperation of Taiwan and USA, the month-long moon phases documentation finally completes. In order to reduce the refraction effect by the atmosphere, the photo sessions were conducted when the moon was at higher viewing angles. But due to the weather condition and change of the moon positions, occasionally they were taken at lower angles during moonrise or moonset. As a result, a few photos are not as sharp as desired.
Libration motion video production was referenced to the 2021 moon phases data on NASA’s website. Individual photos were adjusted so that the viewing angles are identical to the simulated moon phases on the website, and the corresponding orbital locations were downloaded to aid the visualization. Finally, the complete photo set was made into animated video in order to show the moon phase change as well as the libration effect.
This video is comprised of over 1000 filtered images based on my novel methods ISED and ISEE. The heart of these new methods have a foundation in quantum mechanics.
The IC 4406 image was sourced from NASA, and it is of a planetary nebula viewed from the side. At the center of the nebula resides a white dwarf star which is the left-over bits of the star that has died. (No more nuclear fusion.) The star outgasses and any surrounding planets that were not devoured by the expansion of the star is then inundated with gas and dust. The torus that forms(Donut) is due to the star’s spin.
"We are all bits of stardust." -Sagan
Click to play embedded YouTube video.
Original Text:
"The Hubble telescope reveals a rainbow of colours in this dying star, called IC 4406. Like many other so-called planetary nebulae, IC 4406 exhibits a high degree of symmetry. The nebula's left and right halves are nearly mirror images of the other. If we could fly around IC 4406 in a spaceship, we would see that the gas and dust form a vast donut of material streaming outward from the dying star. We don't see the donut shape in this photograph because we are viewing IC 4406 from the Earth-orbiting Hubble telescope. From this vantage point, we are seeing the side of the donut.
This side view allows us to see the intricate tendrils of material that have been compared to the eye's retina. In fact, IC 4406 is dubbed the 'Retina Nebula.'"
Original Image Credit:
NASA/ESA and The Hubble Heritage Team STScI/AURA"
NASA original image link: https://esahubble.org/images/opo0214a/
Processed images: Tim Taylor /ISEEIMAGE
Band Wavelength Telescope
Optical
Oiii 502 nm Hubble Space Telescope WFPC2
Optical
H-alpha 656nm Hubble Space Telescope WFPC2
Optical
Nii 658 nm Hubble Space Telescope WFPC2
Greetings and Salutations,
Tim here, I hope you are all doing well.
This video shows an object that exhibits gravitational lensing as proposed by Albert Einstein's general theory of relativity. The original image was sourced from NASA and processed by several of my algorithms based on QM. ISED and ISEE being the primary algorithms however there are some more advanced variants in this video as well. They say say a picture is worth 1000 words. So here are over 1000 pictures of this lovely stellar phenomena. I hope you enjoy my work, my love, and my precious.
Have a great day.
Click to play embedded YouTube video.
"The narrow galaxy elegantly curving around its spherical companion in this image is a fantastic example of a truly strange and very rare phenomenon. This image, taken with the NASA/ESA Hubble Space Telescope, depicts GAL-CLUS-022058s, located in the southern hemisphere constellation of Fornax (The Furnace). GAL-CLUS-022058s is the largest and one of the most complete Einstein rings ever discovered in our Universe. The object has been nicknamed by the Principal Investigator and his team who are studying this Einstein ring as the "Molten Ring", which alludes to its appearance and host constellation.
First theorized to exist by Einstein in his general theory of relativity, this object’s unusual shape can be explained by a process called gravitational lensing, which causes light shining from far away to be bent and pulled by the gravity of an object between its source and the observer. In this case, the light from the background galaxy has been distorted into the curve we see by the gravity of the galaxy cluster sitting in front of it. The near exact alignment of the background galaxy with the central elliptical galaxy of the cluster, seen in the middle of this image, has warped and magnified the image of the background galaxy around itself into an almost perfect ring. The gravity from other galaxies in the cluster is soon to cause additional distortions.
Objects like these are the ideal laboratory in which to research galaxies too faint and distant to otherwise see."
Original Image Credit:
ESA/Hubble & NASA, S. Jha Acknowledgement: L. Shatz
NASA Link: https://esahubble.org/images/potw2050a/
Other images and Video: ISEEIMAGE /Tim Taylor
Colors & filters
Band Wavelength Telescope
Optical V(B) 555 nm Hubble Space Telescope WFC3
Optical V(G) 555 nm Hubble Space Telescope WFC3
Optical i(G) 775 nm Hubble Space Telescope WFC3
Optical i(R) 775 nm Hubble Space Telescope WFC3
Infrared H(I) 1.6 μm Hubble Space Telescope WFC3
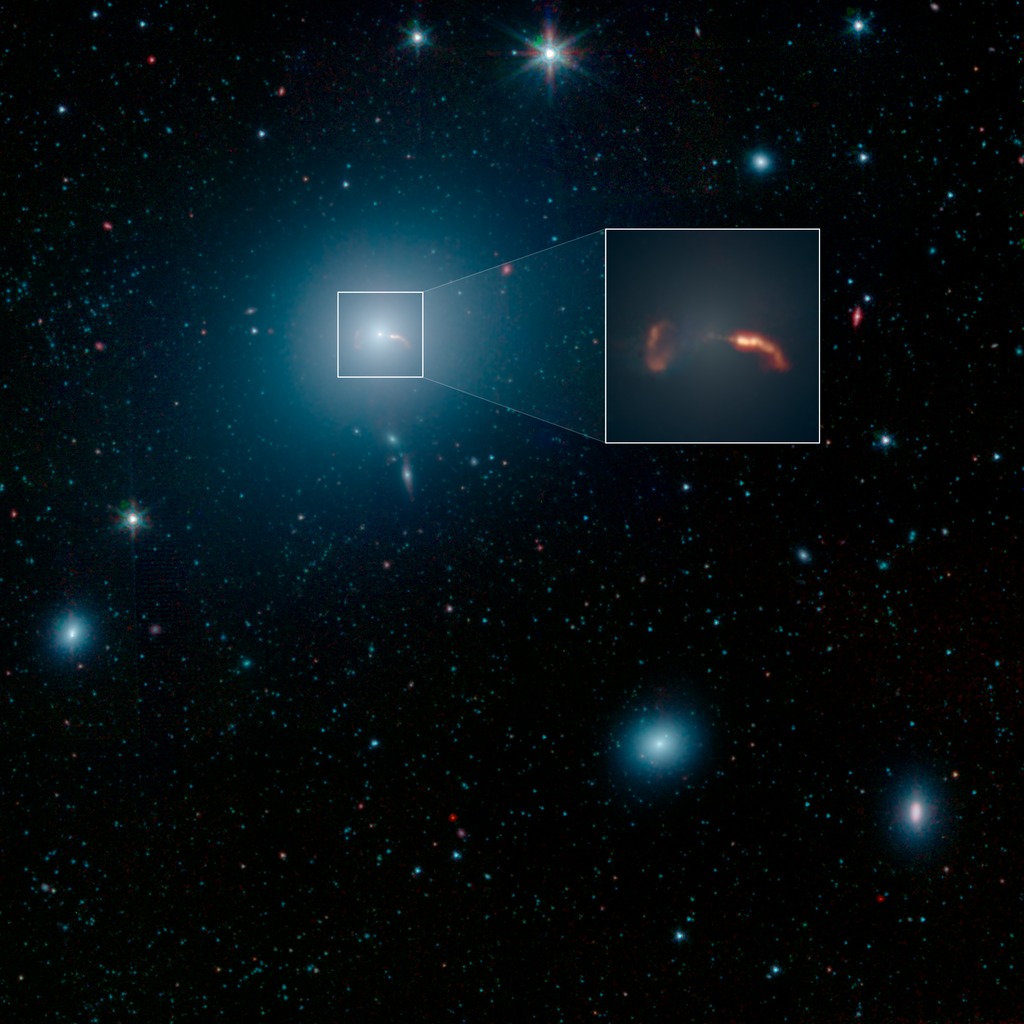
The beauty of space and what lies beyond our pale blue dot inspires the imagination of both young and old. This image contains the beating heart of a supermassive black hole that is actively feeding on matter surrounding it. This is called an active galactic nuclei (AGN) This image was taken by the Spitzer Space Telescope (SST). The SST observes the image in the infrared spectrum (IR) and from that an approximation of what you might see if it were in the visible spectrum. The first image is the original image and the following images are what I have created with a bit of mathematics (QM) and some computer algorithms based on the nature of light. I hope you enjoy my work and you can gain a bit of inspiration, relaxation, or entertainment. I know the world is a mess right now. We need a little hope and must become our own heroes. Help others when you can. Forgive them if possible. Love and dream above all else. We can all be better and do better. We must reach for the stars. Going further and faster than ever before. Finding the details and new depths hidden in the center of M87.
 mejrh known as M51 and NGC 5149, or as it is called Whirlpool Galaxy ..
