
Max Planck Institute for Solar System Research | 2016 July 13
Scientists find that sunspots rise to the surface much more slowly than predicted
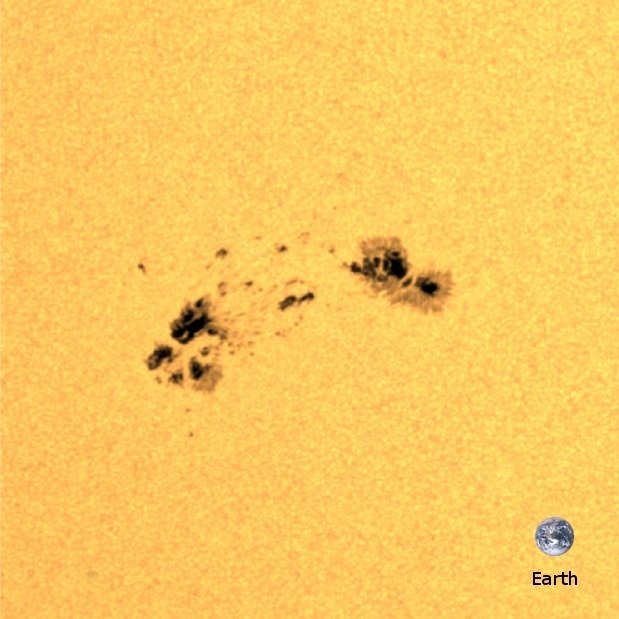
[img3="Solar active region as seen by the Helioseismic and Magnetic Imager on board the NASA Solar Dynamics Observatory. The dark circular regions are sunspots; these regions of strong magnetic field are dark as they are cool. The image of Earth is shown for scale. (Credit: MPS, NASA/SDO/HMI, GDC-SDO/DLR)"]http://www.mps.mpg.de/4622672/standard_sans_both.jpg[/img3][hr][/hr]Solar active regions consist of strongly magnetic sunspots and surrounding regions of more diffuse magnetic field. These regions are the origin of solar activity which controls space weather and causes beautiful phenomena such as aurora but in some cases also damage to satellites or power grids. Solar active regions are thought to be the result of magnetic flux concentrations - bundles of magnetic field lines - rising from deep in the solar interior and penetrating the surface. A team consisting of researchers from the Max Planck Institute for Solar System Research (MPS), The University of Göttingen, NorthWest Research Associates, and the High Altitude Observatory of the National Center for Atmospheric Research has now shown that these magnetic flux concentrations move upward through the solar interior at speeds of not more than about 150 m/s. This is much slower than predicted by the prevailing current model. For their study, which is published today in the journal Science Advances, they compared satellite observations and computer simulations.
A clear sign of a magnetic flux concentration penetrating the surface of the Sun are regions with magnetic fields of opposite polarity. These polarities are clearly visible on magnetic maps provided by the Helioseismic and Magnetic Imager (HMI) instrument onboard NASA’s Solar Dynamics Observatory (SDO). The researchers used these images to identify active regions and to determine the moment of their emergence. ...
But HMI not only provides maps of magnetic fields but also images in the visible light of the solar surface. These data were essential for measuring horizontal flows around the identified active regions. The team measured the surface plasma flows associated with emerging active regions using two methods: They tracked the motion of the small-scale brightness patterns and they also measured the propagation of pressure waves. ...
A Low Upper Limit on the Subsurface Rise Speed of Solar Active Regions - Aaron Birch et al
- Science Advances 2(7):e1600557 (13 Jul 2016) DOI: 10.1126/sciadv.1600557