APOD: Cygnus Without Stars (2020 Nov 30)

Comments and questions about the APOD on the main view screen.
Post Reply
User avatar
APOD Robot
Otto Posterman
Posts: 5345
Joined: Fri Dec 04, 2009 3:27 am
Contact:

APOD: Cygnus Without Stars (2020 Nov 30)

Post by APOD Robot » Mon Nov 30, 2020 5:05 am

Image Cygnus Without Stars

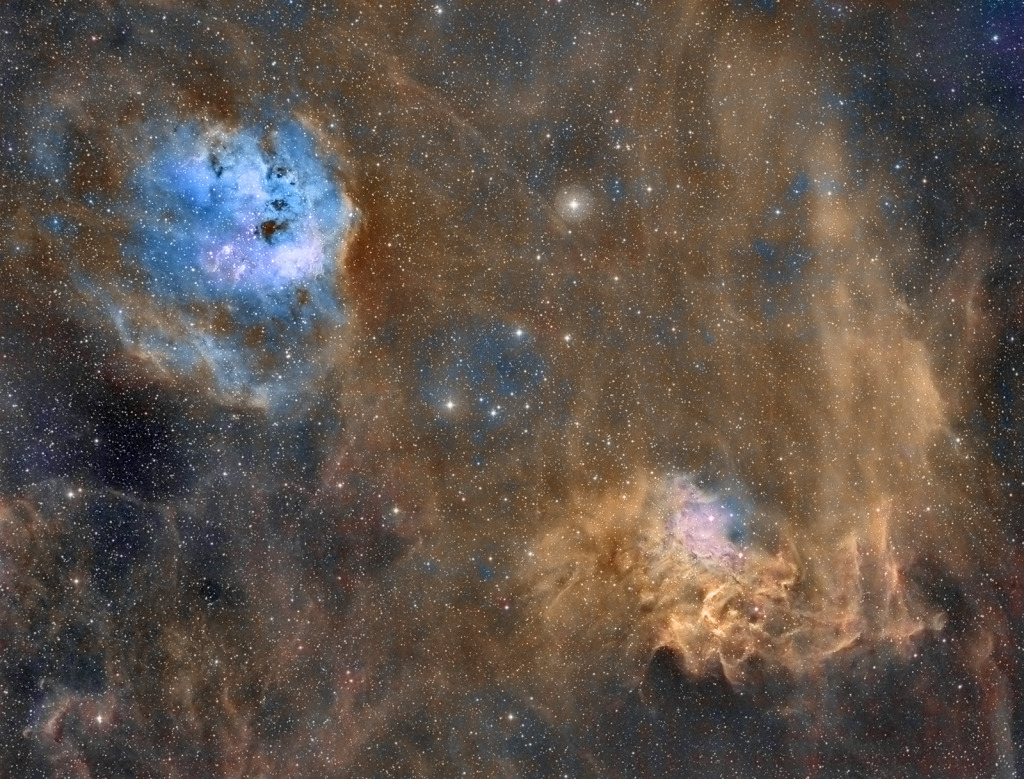
Explanation: The sky is filled with faintly glowing gas, though it can take a sensitive camera and telescope to see it. For example, this twelve-degree-wide view of the northern part of the constellation Cygnus reveals a complex array of cosmic clouds of gas along the plane of our Milky Way galaxy. The featured mosaic of telescopic images was recorded through two filters: an H-alpha filter that transmits only visible red light from glowing hydrogen atoms, and a blue filter that transmits primarily light emitted by the slight amount of energized oxygen. Therefore, in this 18-hour exposure image, blue areas are hotter than red. Further digital processing has removed the myriad of point-like Milky Way stars from the scene. Recognizable bright nebulas include NGC 7000 (North America Nebula), and IC 5070 (Pelican Nebula) on the left with IC 1318 (Butterfly Nebula) and NGC 6888 (Crescent Nebula) on the right -- but others can be found throughout the wide field.

<< Previous APOD This Day in APOD Next APOD >>

heehaw

Re: APOD: Cygnus Without Stars (2020 Nov 30)

Post by heehaw » Mon Nov 30, 2020 10:24 am

What a nice idea! And scientifically interesting and helpful as well as beautiful!

User avatar
orin stepanek
Plutopian
Posts: 8200
Joined: Wed Jul 27, 2005 3:41 pm
Location: Nebraska

Re: APOD: Cygnus Without Stars (2020 Nov 30)

Post by orin stepanek » Mon Nov 30, 2020 1:30 pm

CygnusStarless_Cameron_960_annotated.jpg
:lol2:
Orin

Smile today; tomorrow's another day!

User avatar
Ann
4725 Å
Posts: 13373
Joined: Sat May 29, 2010 5:33 am

Re: APOD: Cygnus Without Stars (2020 Nov 30)

Post by Ann » Mon Nov 30, 2020 4:19 pm

orin stepanek wrote: Mon Nov 30, 2020 1:30 pm CygnusStarless_Cameron_960_annotated.jpg :lol2:
That's so funny! :lol2:

Ann
Color Commentator

User avatar
orin stepanek
Plutopian
Posts: 8200
Joined: Wed Jul 27, 2005 3:41 pm
Location: Nebraska

Re: APOD: Cygnus Without Stars (2020 Nov 30)

Post by orin stepanek » Mon Nov 30, 2020 10:03 pm

Sometimes my imagination sees things in these nebulae! 8-)
Orin

Smile today; tomorrow's another day!

Ralph Paonessa
Asternaut
Posts: 1
Joined: Tue Dec 01, 2020 6:15 pm

Re: APOD: Cygnus Without Stars (2020 Nov 30)

Post by Ralph Paonessa » Tue Dec 01, 2020 6:26 pm

Beautiful picture. But I’m puzzled by this in the description : “Therefore, in this 18-hour exposure image, blue areas are hotter than red.”

I realize that blue stars are hotter than red ones. And O III emission is blue and so higher energy than Red H II. But does this tell us anything about the temperature of those regions?? It seems like it really tells us about the distribution of oxygen and hydrogen in these areas.

Ralph (curious amateur)

User avatar
Ann
4725 Å
Posts: 13373
Joined: Sat May 29, 2010 5:33 am

Re: APOD: Cygnus Without Stars (2020 Nov 30)

Post by Ann » Tue Dec 01, 2020 7:41 pm

Ralph Paonessa wrote: Tue Dec 01, 2020 6:26 pm Beautiful picture. But I’m puzzled by this in the description : “Therefore, in this 18-hour exposure image, blue areas are hotter than red.”

I realize that blue stars are hotter than red ones. And O III emission is blue and so higher energy than Red H II. But does this tell us anything about the temperature of those regions?? It seems like it really tells us about the distribution of oxygen and hydrogen in these areas.

Ralph (curious amateur)
These mapped color images!!!

Here's the deal. In mapped color images, blue usually means ionized oxygen emission (of circa 501 nm). Green often means ionized hydrogen emission (of circa 656 nm), and sometimes red means ionized hydrogen emission. But often red means ionized sulfur emission (of circa 658 nm). (Sigh.)

Let's cut to the chase. It takes a lot more energy to ionize oxygen and make emit photons of 501 nm than it takes takes to ionize hydrogen and make it emit photons of 656 nm. In narrowband imagery, blue color typically means that a very energetic phenomenon has ionized oxygen atoms into OIII ions and made them emit their photons of 501 nm. But the reason why they have done this is that a very energetic source has affected them.


Take a look at these two pictures of emission nebulas IC 405 and IC 410. In optical light, IC 405 is a reddish-pink nebula that also contains some blue light that has been scattered from the hot star passing through this nebula and ionizing it. IC 410 is more brick red in color than IC 405 overall, because IC 410 is located much farther away from us, and is reddened by intervening dust.

In mapped color, IC 410 becomes blue, because it contains a cluster of hot stars that emit a lot of ultraviolet light, which in turn ionizes oxygen and makes it glow green. IC 405, by contrast, contains a lot less ultraviolet light, because it is ionized by a single passing star. Not much oxygen is being ionized there.

And that's the best I can do when it comes to explaining why mapped color looks the way it looks.

Ann
Color Commentator

User avatar
Chris Peterson
Abominable Snowman
Posts: 18112
Joined: Wed Jan 31, 2007 11:13 pm
Location: Guffey, Colorado, USA
Contact:

Re: APOD: Cygnus Without Stars (2020 Nov 30)

Post by Chris Peterson » Tue Dec 01, 2020 7:55 pm

Ralph Paonessa wrote: Tue Dec 01, 2020 6:26 pm Beautiful picture. But I’m puzzled by this in the description : “Therefore, in this 18-hour exposure image, blue areas are hotter than red.”

I realize that blue stars are hotter than red ones. And O III emission is blue and so higher energy than Red H II. But does this tell us anything about the temperature of those regions?? It seems like it really tells us about the distribution of oxygen and hydrogen in these areas.

Ralph (curious amateur)
I wouldn't take the observation very seriously. While ionizing oxygen is a more energetic process than ionizing hydrogen (for the transitions involved here), the relative intensities of hydrogen and oxygen regions is a poor proxy for temperature. Consider that the same temperatures that will ionize oxygen will also ionize hydrogen, but you'll only see red if there is not much oxygen present.

The temperature of gases in nebulas like this is typically assessed by looking at the width of spectral lines, or by looking at the ratio of intensities of particular lines (e.g h-alpha/h-beta).
Chris

*****************************************
Chris L Peterson
Cloudbait Observatory
https://www.cloudbait.com

Post Reply