Ann wrote: ↑Tue Jun 27, 2023 4:34 am
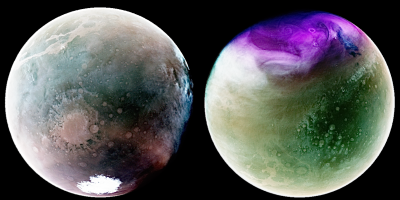
MAVEN's Ultraviolet Mars
Image Credit: MAVEN, Laboratory for Atmospheric and Space Physics, Univ. Colorado, NASA
APOD Robot wrote:
Recorded by the MAVEN spacecraft's Imaging Ultraviolet Spectrograph instrument in July 2022 (left) and January 2023, three otherwise invisible ultraviolet bands are mapped into red, green, and blue colors. That color scheme presents the Red Planet's surface features in shades of tan and green. Haze and clouds appear white or blue, while high altitude ozone takes on a dramatic purple hue.
Note that we don't get to know what the mapped colors represent. Do the colors represent intensity or wavelength? Why does Mars look very green in the picture at right, but not nearly so green in the picture at left? Why is there an enormous purple splotch in the picture at right, but no sign of purple whatsoever in the picture at left? Is Mars brighter in ultraviolet light in the picture at right than in the picture at left? If so, is there a reason why?
Mars' atmosphere doesn't protect Mars from the ultraviolet light from the Sun, but the Earth's atmosphere does a good job of protecting the Earth. Does that mean that the surface of Mars is brighter in ultraviolet light than the surface (including the oceans) of the Earth?
I'm not a great fan of mapped color, but mapped color works if the colors are explained.
. . . (counterexample followed) . . .
Well, there you have it, clear as day. So please, if you are going to publish mapped color images, please explain to us what the colors mean!
Ann
You're quite right, I say! More explanation would be nice.
I did find this:
https://lasp.colorado.edu/maven/files/2 ... N_IUVS.pdf
That PDF is titled: "The Imaging Ultraviolet Spectrograph (IUVS) for the MAVEN Mission"
Authored by: William E. McClintock · Nicholas M. Schneider · Gregory M. Holsclaw · John T. Clarke ·
Alan C. Hoskins · Ian Stewart · Franck Montmessin · Roger V. Yelle · Justin Deighan
Now 50 pages of explanation is probably more than you wanted. But there is a nice diagram in it with a helpful caption.
I think it applies to the two images for today's APOD. In which case the map is: 310nm -> red, 255nm -> green, 130nm -> blue.
Then the lower pictures in the diagram show how a composite is made and describe some of the features that become evident in such composites.
If I'm piecing this together correctly, then both of the two images in today's APOD were made in the same manner. But they show the striking difference in the features over time. The left image was taken at a Martian perihelion in 2022 and the right image near Martian aphelion in 2023. The reason only one of the two images has a large purple area is that only in that shot did Mars have a lot of ozone build up in its atmosphere. The project scientists may have figured out why, or when to expect more or less ozone, but that is beyond me.
A simple idea would be that ozone builds up when Mars is farther from the sun, but I'm really speculating on just this shred of data, so it's unlikely to be that simple. It's true that Mars' orbit is a lot more eccentric than Earth's, so it may do a lot more to create global seasons than do the perihelion and aphelion of Earth which (I think) have very little effect on our global average temperature (at least over short terms).

 MAVEN's Ultraviolet Mars